
Data centers rank among the world’s fastest-growing real estate asset classes, driven by surging AI and cloud computing. According to CBRE’s Global Data Center Trends, the global vacancy rate fell to a low of 6.6% in Q1 2025, down 2.1 points year-over-year, with North America hitting a record-low 1.6% and under-construction pipelines surging amid power constraints.
Key Takeaways:
• Data center clients optimize for efficiency and capacity, not design awards, but they still care deeply about how their facilities look.
• Form follows function: Windows, doors, and layouts are dictated by cooling, security, and equipment access.
• Exterior renders and aerial views dominate; interior visualization is rarely requested.
$3 trillion investment supercycle
JLL’s 2026 Global Data Center Outlook projects the sector will nearly double to 200 GW by 2030, adding 100 GW from today’s 103 GW, fueled by a $3 trillion investment supercycle including $1.2 trillion in real estate asset value. As seen in the U.S., AI data center equipment and infrastructure spending is expected to reach $1 trillion annually by 2030, with companies like Alphabet, Amazon, and Meta spending hundreds of billions a year to build out the physical footprint of their AI businesses.
After the extraordinary growth and delivering renderings for seven data center projects across Greece, United Kingdom, the Netherlands, and other European markets, our team has learned that visualizing these facilities requires a different approach than traditional architecture.
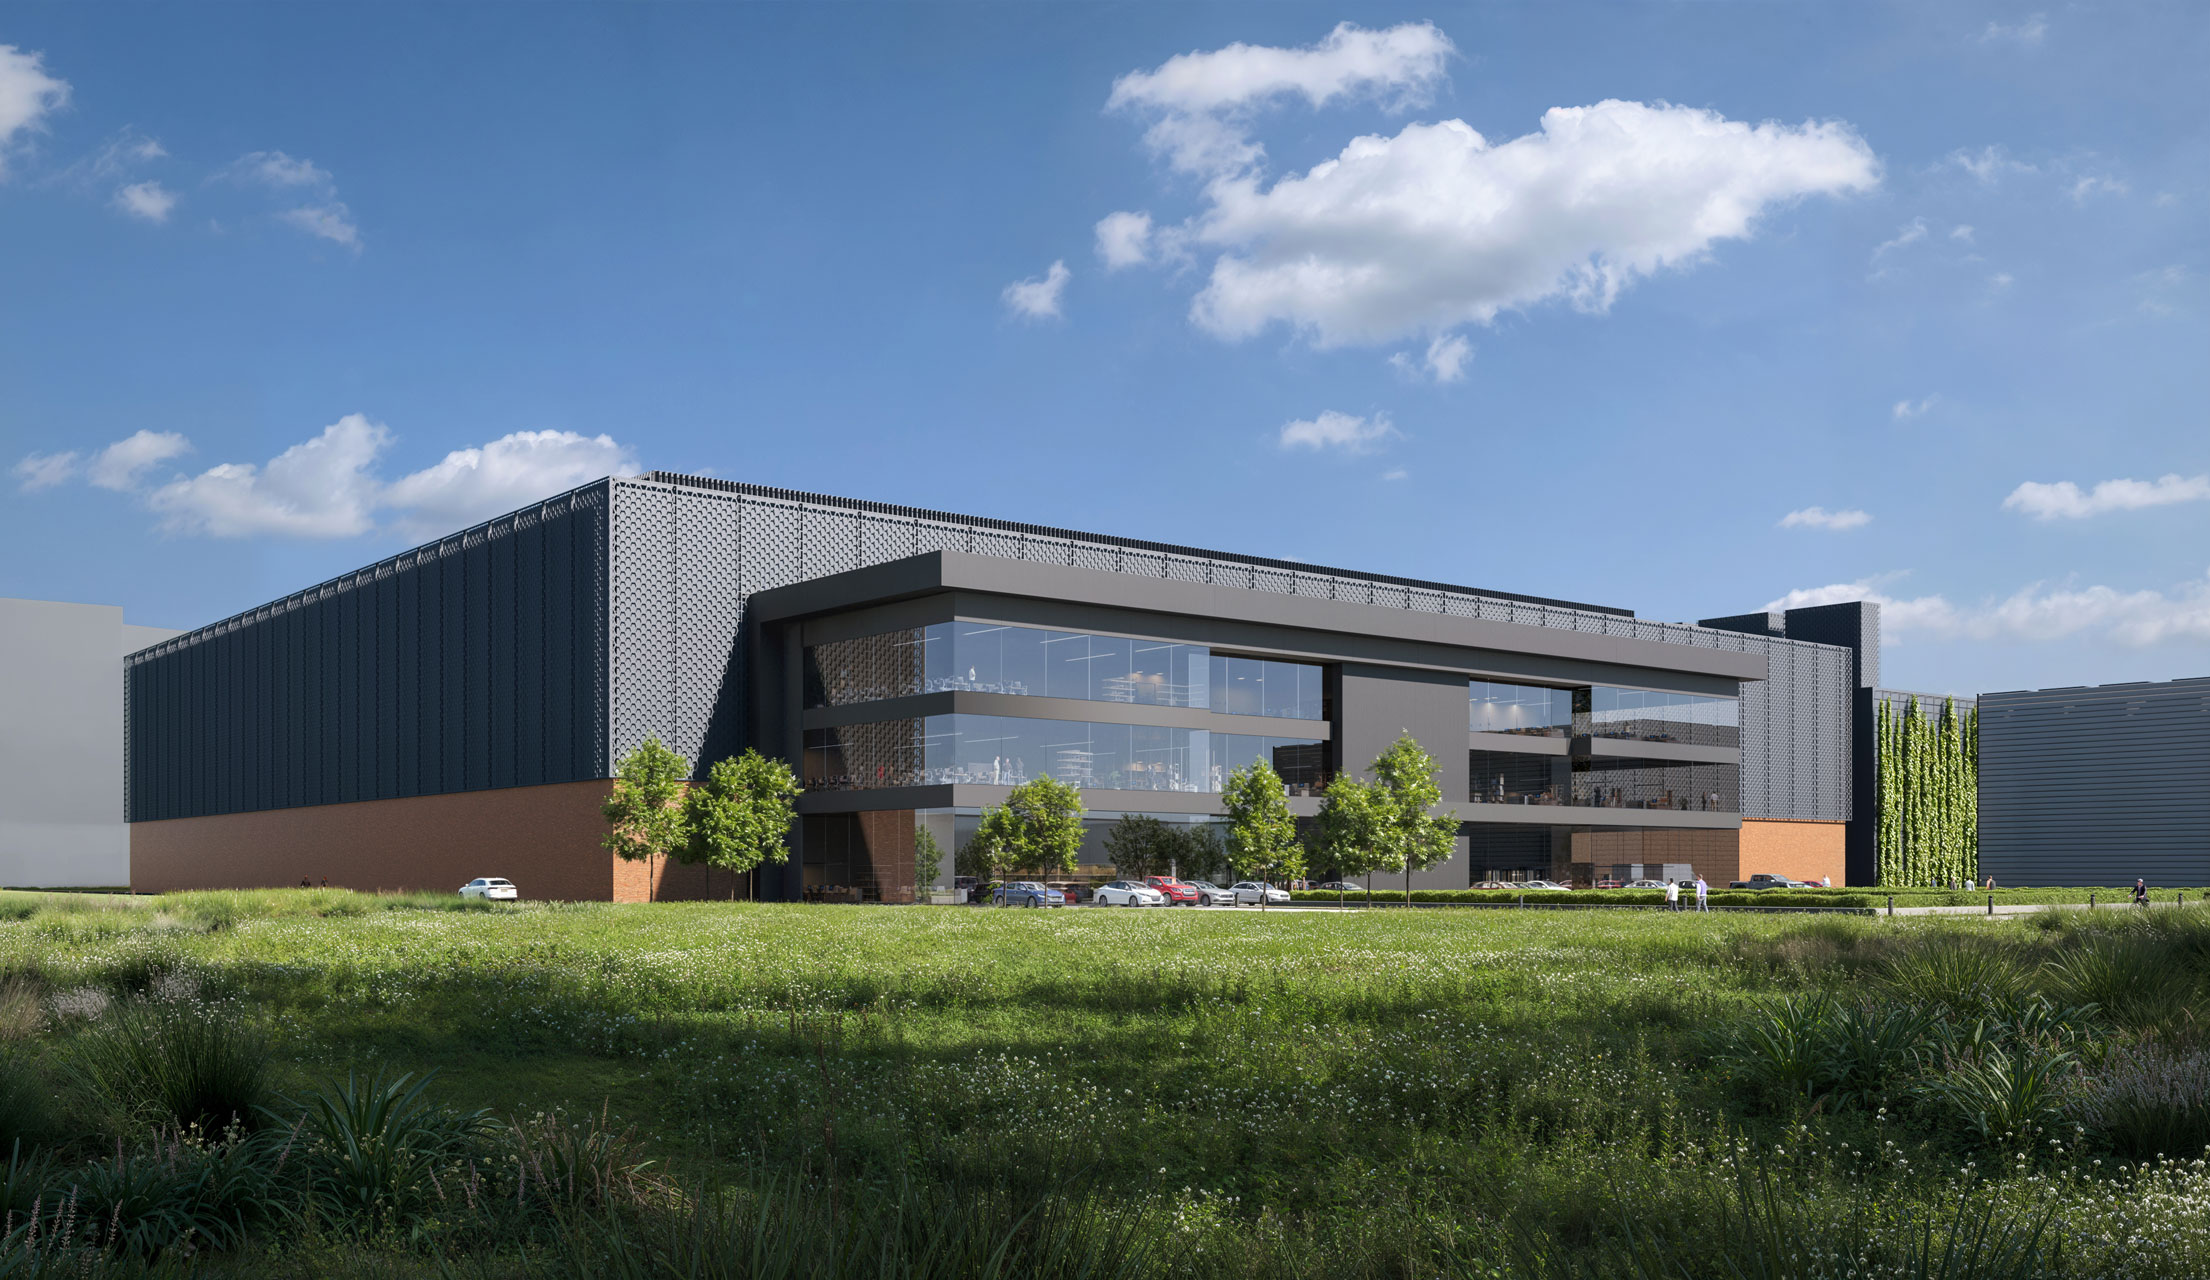
The Charlton Riverside data center in London, designed by TTSP, exemplifies this approach, exterior-focused visuals that blend site context and human scale to maximize investor appeal.
Color becomes the primary tool
When an architect designing a cultural center or residential tower commissions CGI, the conversation centers on design intent, materiality, and emotional impact. Data center developers ask different questions: How do we show the site infrastructure? Can investors understand the scale? For instance, in Arizona’s Hassayampa Ranch, a proposed 2,000-acre data center rezoning highlights the massive scale involved, where power needs could be equivalent to over a million homes and water usage raises concerns in arid regions.
The projects we’ve worked on were designed with considerable care, detailed façades, thoughtful material choices, and attention to how the building sits on its site. But the underlying priorities differ. The main purpose for them is to showcase the data center’s capability.
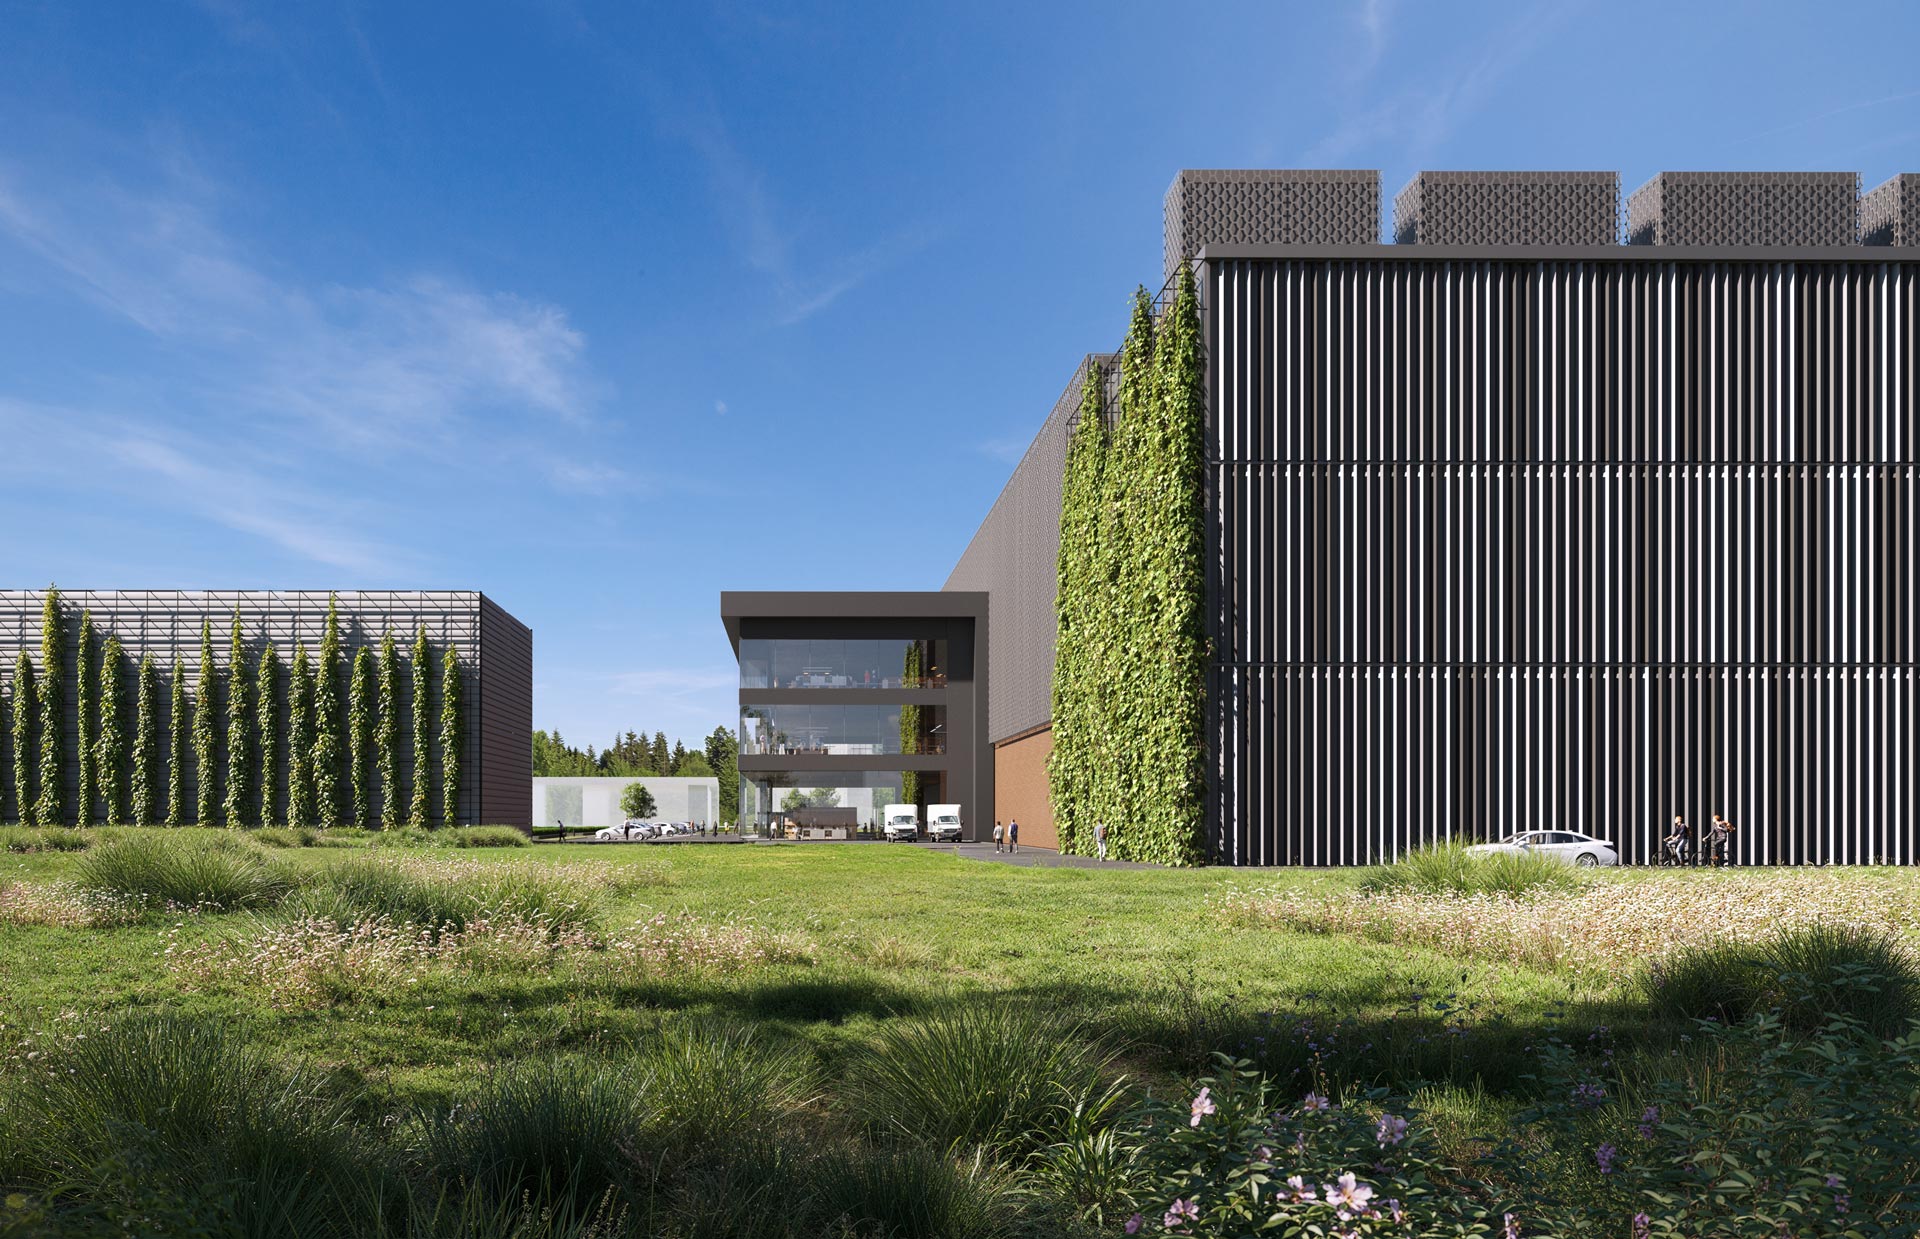
This doesn’t mean aesthetics are irrelevant. In fact, several of our clients specifically chose bold colors, such as blues, greens, and unexpected accent tones, because their facilities sit along highways where they’re visible to passing traffic. When structural form is constrained by functional requirements, color becomes the primary tool for differentiation.
Constraints architects don’t see coming
Data center architecture operates under rules that would surprise most traditional designers. Our teams learned these through direct experience: windows aren’t just windows, they serve ventilation and security functions simultaneously. You cannot see into the building from outside; that’s by design. Door placement isn’t about creating an inviting entrance, it’s about parking equipment trucks close enough to move heavy machinery inside without crossing the entire site. Additionally, as illustrated in rural U.S. developments like those in Arizona, these facilities must address local concerns over energy, water, and land use, with power-hungry GPU racks in gigantic AI data centers humming with energy- and water-hungry systems.
The structure itself must support massive air extraction systems as well. The building layout follows cooling paths and power distribution requirements, not spatial flow or user experience. These constraints mean that what looks like “boring architecture” to an untrained eye is actually highly optimized engineering.
For visualization, this creates an interesting challenge: how do you make something compelling when the most important features are deliberately hidden?
What data center visualization actually requires
Unlike residential or commercial projects where interior renders sell the vision, data center clients rarely ask for interior visualization. In our seven projects, we delivered zero interior CGI. When asked about interiors, clients typically respond with “think of office space”, even though the actual machinery and infrastructure represent the facility’s core value. This aligns with broader trends where the focus is on external impacts.
Instead, visualization efforts concentrate on a few key deliverables. Aerial views showing the full development footprint appear in nearly every brief, clients want investors to understand scale and site coverage at a glance. Entrance shots demonstrate that this is a workplace where people arrive, not just a warehouse for machines. And façade details prove the building isn’t just another industrial shed.
To make these boxes feel alive, we rely on mood, context, and human presence. Bright daylight appropriate to the project’s geography. Greenery and landscaping to soften industrial edges. And always people, someone arriving on a bike, walking toward the entrance, creating the impression of a functioning workplace rather than an unmanned facility.
Working with data center architects
Architects who work on data center projects tend to approach collaboration differently from those focused on cultural or residential buildings. The projects we’ve delivered in this sector ran smoothly largely because these teams understand that visualization is a distinct discipline with its own process, timeline, and expertise.
Once the architectural and engineering groundwork is defined, these architects are generally comfortable handing over the material and allowing our visualization team to make informed creative decisions. On these projects there’s less back-and-forth on artistic interpretation, fewer debates about mood or composition. Architects and developers do their engineering work; they expect us to do our visual work. This professional clarity makes for efficient projects and realistic timelines.
From a budget perspective, data center developments involve significant capital investment overall, JLL estimates global construction costs at $11.3 million per megawatt. However, that doesn’t automatically translate into unlimited visualization budgets. Like any other project type, fees are negotiated and cost efficiency matters. The key difference is not the absence of budget pressure, but that these projects are not driven by the same market sensitivities as smaller, design-led developments. Visualization remains a scoped service with its own value, and it is treated accordingly.
In the U.S. context, this is evident in high-stakes investments, where data centers are projected to transform once-modest server farms into sprawling mega-complexes spanning millions of square feet.

Hiding the best features
The most striking aspect of data center visualization is what’s absent. Despite the industry’s focus on renewable energy integration, cooling innovation, and ESG compliance, we’ve never been asked to visualize these technical features. Sustainability appears in renders through landscaping and green surroundings, literal greenery rather than technical diagrams of efficiency systems.
Yet, real-world challenges like those in drought-prone areas underscore the need for such innovations; for example, Arizona regulators have issued certificates for large-scale water supply to support data centers.
Interior complexity remains invisible. In most cases, clients choose not to present server halls, cooling infrastructure, or power distribution systems through rendered imagery. When interior spaces are referenced at all, they are shown in a highly simplified, non-technical manner.
The operational core of a data center, racks, containment systems, mechanical equipment, is usually communicated through technical documentation and performance data rather than visuals. Whether this is because the spaces are highly repetitive, too technical for broader stakeholder audiences, or simply better explained through specifications rather than imagery, the result is the same: the most complex systems remain outside the scope of visualization.
For architects and developers entering this market, this represents both a limitation and an opportunity. The visualization conventions for data centers remain underdeveloped compared to other asset classes. There’s no standardized shot list, no established package of deliverables. Each project starts from first principles.
As the boom accelerates, with U.S. data centers drawing from examples, visualization will need to evolve to convey not just scale and design, but also the socio-economic dynamics in rural communities.